Compounding is what happens when the growth on your money starts earning growth of its own.
This is the lump sum version. One amount, left alone, for years. If you are adding to it every month instead, use the SIP calculator linked at the end.
Interest against what you put in
Each bar is one year. The dark base never changes. Everything above it is interest.
How often it compounds
Same money, same rate, same years. Only the compounding changes.
This assumes the return arrives steadily and nothing is added or taken out along the way. Real returns move up and down, so treat the shape of the curve as the lesson rather than the final figure.
How to read the chart
Each bar is one year. The dark block at the bottom is the money you put in, and it is exactly the same height in every bar. You never add to it. Everything above it is interest.
Look at the first few years. The light part is barely there. This is the stage where people decide investing does not work and stop. Now look at the last few. The light part dwarfs the dark. Nothing changed except time.
Why the curve bends
In year one you earn interest on your money. In year two you earn interest on your money and on last year's interest. By year twenty most of what you are earning is interest on interest. Your original amount stopped being the main character a long time ago. This is why the last years matter so much more than the first ones. Try it above. Set twenty years, note the figure, then change it to twenty five. Five extra years does not add a quarter. On common assumptions it adds far more, because those are the five years when the balance is largest.
How often it compounds
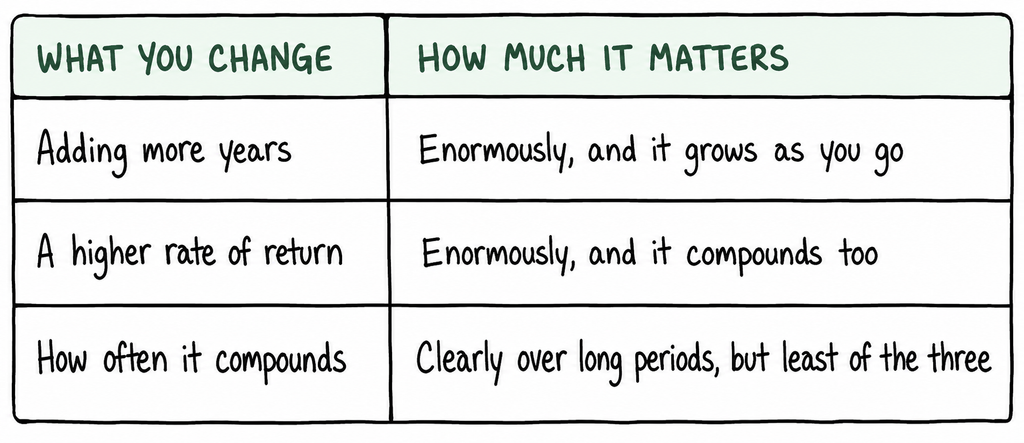
Look at the panel above. Switch between yearly and monthly and watch the figure move. It is not nothing. At ten per cent over twenty years, monthly compounding gives you about nine per cent more than yearly. Stretch it to twelve per cent over thirty years and monthly is roughly 20% ahead.
So the frequency is worth checking. It is just worth checking after the two things that matter more.
Here is the practical use. Two products can quote the same rate and not be the same product, because one compounds monthly and the other yearly. So ask for the effective yearly rate, which folds the frequency in and lets you compare them properly. Ten per cent compounded monthly is really about 10.5 per cent a year.
The rule of 72
There is a shortcut worth carrying in your head. Divide 72 by the rate of return and you get the rough number of years for money to double. At nine per cent, money doubles in about eight years. At twelve per cent, about six.
It works in the other direction too, which is the use people forget. At six per cent inflation, prices double in about twelve years. That is what your money in a current account is quietly losing to.
The calculator shows both the exact figure and what the rule guesses, so you can see how close the shortcut gets.
If you are investing every month rather than once, the SIP calculator is the right tool. To work out how much you could put away in the first place, try the savings rate calculator, and the net worth calculator will show you where the result sits against everything else you own.
This calculator is for learning. It is not personal financial advice and it is not a forecast. It assumes a steady return with nothing added or withdrawn, which no real investment provides. Tax and charges are ignored, and both reduce what you actually receive. Money that can grow can also fall in value. For advice about your own situation, speak to a SEBI-registered investment adviser.