

A headline saying Tamil Nadu’s GST collections fell can sound like a warning about the state’s finances. But the September 2026 numbers tell two different stories: GST collected on domestic transactions in Tamil Nadu declined, while the state’s SGST revenue after interstate settlement increased.
For April–September 2026, Tamil Nadu’s gross domestic GST fell 3.2% year on year. Its post-IGST-settlement SGST rose 16%. Both figures can be correct. They measure different things.
First, know which GST number you are reading
Gross domestic GST generated in Tamil Nadu is a convenient description of the collections attributed to taxpayers in the state. In the September release, it comprises CGST, SGST and domestic IGST. It excludes GST on imports of goods and is measured before refunds. It is not the amount retained by the Tamil Nadu government, nor a direct measure of everything produced or consumed in Tamil Nadu.
Pre-settlement SGST is the SGST component collected before IGST is allocated to states. Post-settlement SGST adds the SGST portion of IGST settled to Tamil Nadu. This is more relevant when asking how the state’s GST revenue is performing. It is still a specific monthly-release measure, rather than a substitute for final audited state accounts or total state revenue.
September: a decline in collections, an increase after settlement
The official GSTN release dated 1 October 2026 reports the following figures for Tamil Nadu.
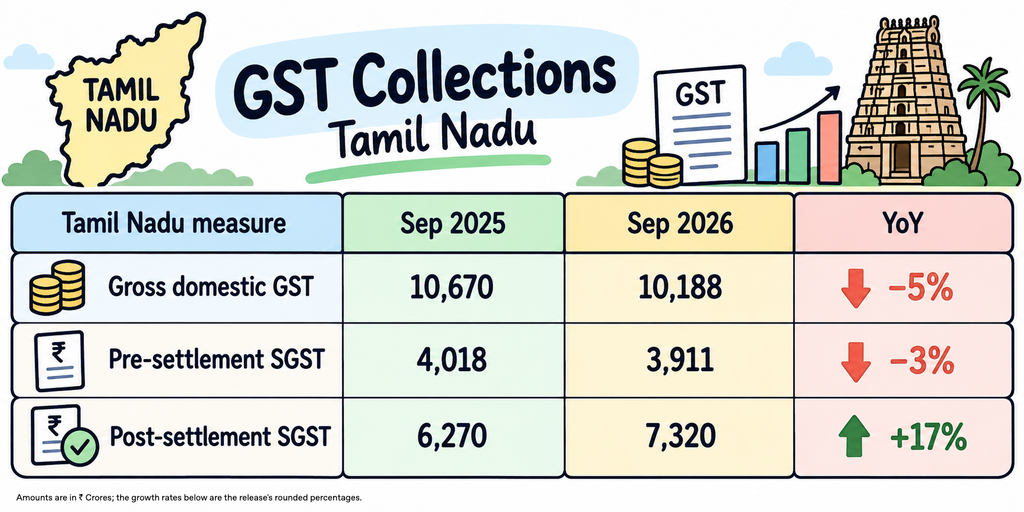
The headline domestic collection fell by ₹482 crore, or about 4.5% using the displayed amounts. Yet post-settlement SGST increased by ₹1,050 crore. Subtracting pre-settlement SGST from post-settlement SGST implies an IGST settlement component of ₹2,252 crore in September 2025 and ₹3,409 crore in September 2026. That increase more than offset the ₹107 crore decline in direct SGST. These differences are our calculations from the published figures.
The six-month comparison matters more
A single month can be affected by payment timing and the previous year’s base. The April–September comparison shows that Tamil Nadu’s domestic GST weakness extends beyond September. Over these six months, pre-settlement SGST fell from ₹24,362 crore to ₹23,847 crore, while post-settlement SGST rose from ₹38,119 crore to ₹44,266 crore.
The same official report shows the following year-on-year changes for four large states. Gross domestic GST growth is reported to one decimal place; post-settlement SGST growth is rounded to whole percentages.
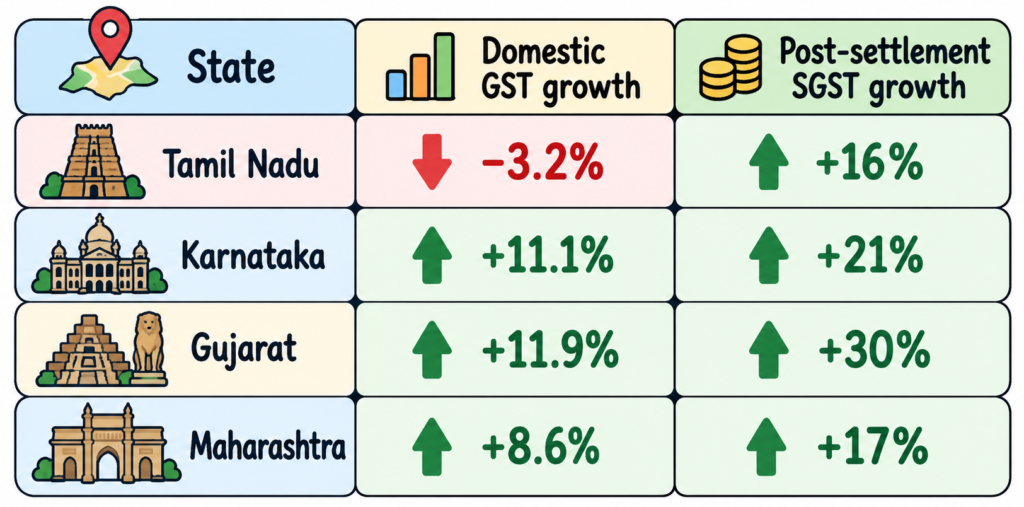
Tamil Nadu’s domestic GST growth was 14.3 percentage points below Karnataka’s and 15.1 points below Gujarat’s. That is a real difference in this collection measure. Settlement improves the picture for Tamil Nadu’s state revenue, but does not explain why its domestic collections lagged these peers.
Why production and state GST revenue can move differently
GST is a destination-based consumption tax. Broadly, the state share follows the place of consumption under the place-of-supply rules, rather than simply the location of a factory.
Imagine a manufacturer in Chennai selling machinery for final use in Bengaluru. The interstate supply attracts IGST; the state share is allocated through the GST system according to the destination and applicable rules. Tamil Nadu does not retain that state share merely because the machine was made there. Conversely, purchases for final consumption in Tamil Nadu from suppliers in another state can contribute to IGST settlement into Tamil Nadu. Business purchases also involve input-tax credits, so this is an illustration of the principle, not a one-invoice formula for monthly settlement.
Exports are another reason output and GST need not move together. Under Section 16 of the IGST Act, exports are zero-rated, subject to the relevant conditions and refund procedures. More export production can support economic activity without producing a matching increase in domestic GST receipts. That is a mechanism worth examining, not proof that exports caused Tamil Nadu’s 2026 decline.
Why did other states grow? What we can and cannot say
The 2025 GST rate rationalisation was a national reform, with most changes scheduled from 22 September 2025. Lower rates can reduce tax collected on a given taxable sale. But states have different mixes of goods, services and consumption, so the same reform can affect them differently. The national change alone does not establish why Tamil Nadu fell while these peers grew.
Differences in taxable sales, sector composition, exports, input-credit use, registration patterns, large payments and collection timing are possible explanations to investigate. The state totals do not tell us how much each contributed. Nor does the higher settlement component prove that Tamil Nadu’s household consumption grew by the same percentage: settlement includes wider allocation and credit-utilisation mechanics.
A collection gap is not evidence of tax evasion. Establishing a compliance problem would require separate evidence, such as audit findings, return discrepancies or enforcement outcomes tied to the period. We cannot label the unexplained difference as tax leakage or attach a rupee loss to evasion from these tables.
How to read the next GST headline
Check the measure, the period and the comparison. Is it domestic GST before refunds, direct SGST, or SGST after IGST settlement? Is the comparison monthly or cumulative? Are imports included? For Tamil Nadu, those checks turn a simple ‘GST is falling’ headline into a more useful question: why are domestic collections weak even as post-settlement state GST revenue grows?
As of the September 2026 release, the evidence supports a careful conclusion: Tamil Nadu’s domestic GST collections underperformed these large-state peers, while its post-settlement SGST revenue increased. The collection data establishes that divergence. Explaining its causes requires more detailed evidence and we will publish the same sooner once we complete our detailed analysis.
Source and method: GSTN’s September 2026 revenue report, tables 1 – 4 and the national summary, released 1 October 2026. Figures are provisional and may change on finalisation. April–September compares the first six months of FY 2026–27 with the corresponding period of FY 2025 – 26. Calculations use displayed rounded amounts. Checked on 2 October 2026.