
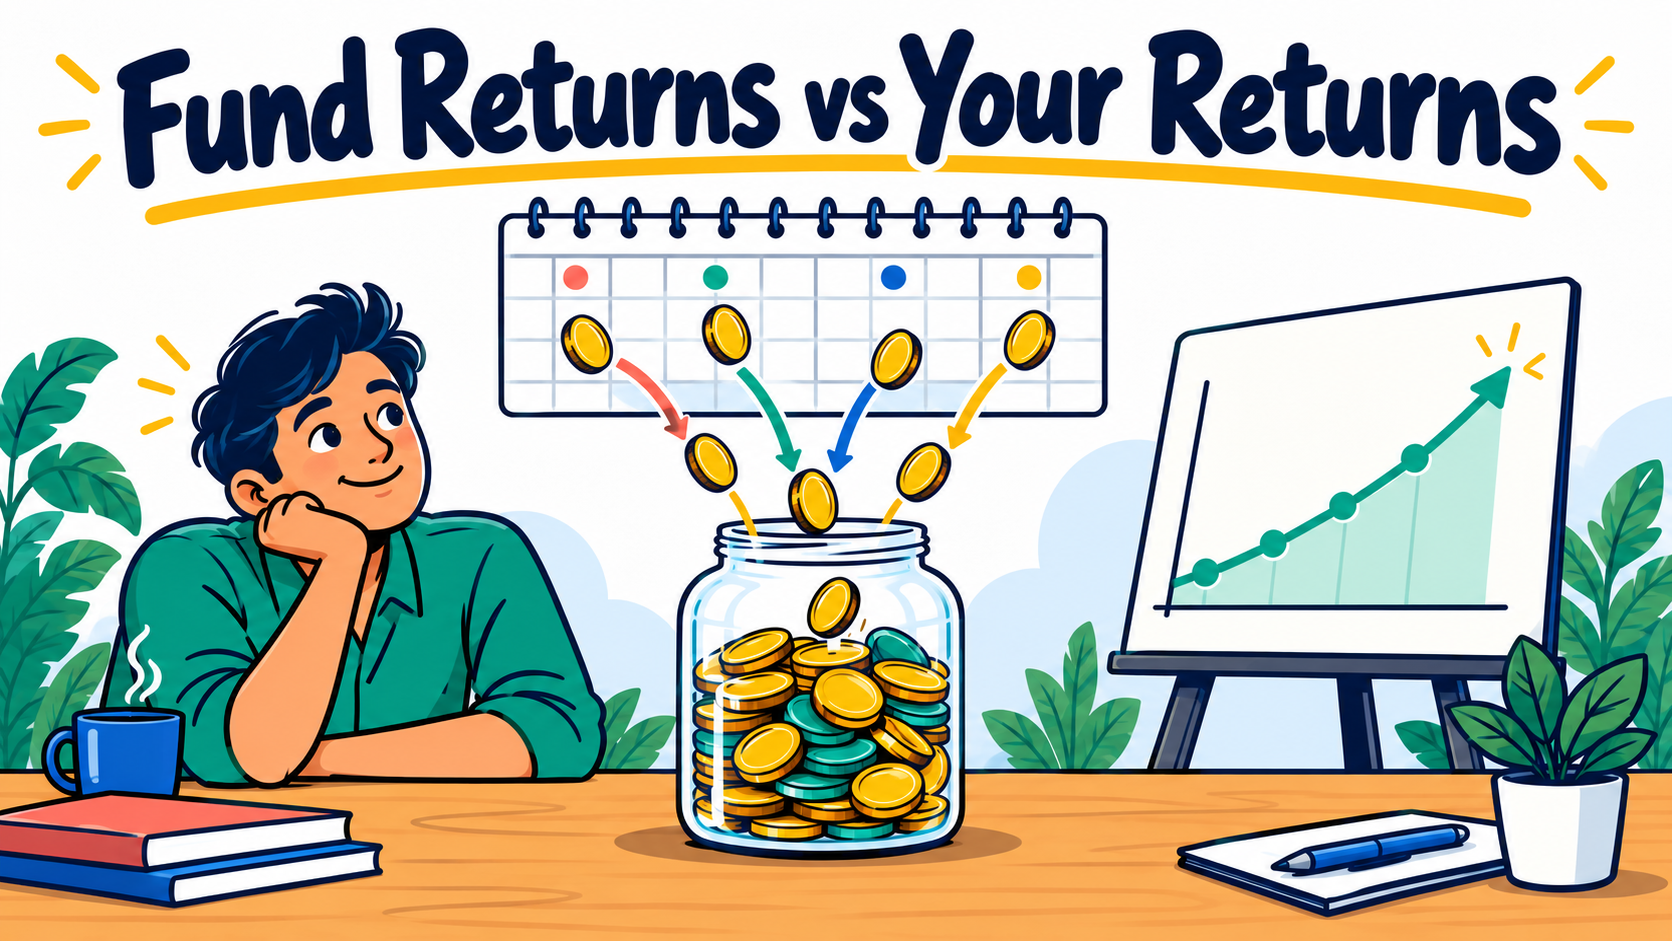
A fund’s page says it returned 12%. Your investment app shows a gain of 5%. Before you assume something is wrong, check what each number measures. The fund’s result follows a particular investment period. Your result follows the dates on which your own money entered and left.
A fund return belongs to a starting date
Suppose the price of one unit in a made-up mutual fund is ₹10 at the start of a year and ₹12 at the end. A person who invests once at the start, makes no withdrawals and holds throughout has a 20% gain before investor-level taxes and charges. A unit is simply a small share of the fund. Its published price is often called NAV.
That 20% does not say what happened to money invested halfway through the year. It also does not describe a person who added a much larger amount near the end. Two people can own the same fund and get different personal results.
A simple example: the fund rises, but your money loses
Keep the same imaginary year. You invest ₹10,000 when a unit costs ₹10, buying 1,000 units. Later, you invest another ₹90,000 when a unit costs ₹15, buying 6,000 units. By the end of the year the unit price is ₹12.
You now own 7,000 units worth ₹84,000. You put in ₹1,00,000, so your money is down ₹16,000, or 16%, before taxes and charges. Yet the fund’s unit price went from ₹10 at the start of the year to ₹12 at the end: a 20% rise.
Both statements are correct. Most of your money entered at the higher price. The example is deliberately simple and invented; it is not a real fund’s performance. It shows why a fund’s headline number is not a receipt for your own investment.
Monthly investments need their own calculation
With a monthly SIP, you invest a fixed amount regularly. January’s money has been invested longer than December’s money. Subtracting the total paid in from the current value tells you the rupee gain or loss, but it does not fairly express a yearly return for money invested on different dates.
Many statements use a number called XIRR. You do not need to memorise the name. Think of it as an annual return calculated using the date and amount of each payment, each withdrawal and the ending value. HDFC Mutual Fund’s explanation describes this method for investments with payments on different dates.
The result can move sharply over a short holding period. A few months of gains expressed as a yearly rate are not a promise for the next twelve months. Check the period alongside the number. For a single investment held several years, a statement may show an average yearly growth rate instead. A 30% total gain over three years does not mean 30% each year.
Check that you are comparing the same thing
Read the full scheme name, whether it is the direct or regular plan, and whether income is paid out or retained in the fund. Use the same start date and end date. A five-year fund return and your eight-month SIP result answer different questions.
Also check whether the published figure includes any cash paid out by the fund. If you received a payout, include that money in your personal result. For withdrawals, include both the money already received and the value still invested. Looking only at the remaining balance can make a profitable investment appear to have lost money.
Fees and tax need a separate look
The ongoing expenses of the fund are already reflected in its unit price. Do not subtract the fund’s expense percentage again from a return calculated from those prices. Direct and regular plans can have different ongoing expenses. Our article on direct and regular plans explains that difference.
An app’s return may still exclude tax payable when you sell, a charge for selling early, or fees paid separately to an adviser or platform. Check what the displayed figure includes. The return on your statement and the money you can finally spend may differ.
Use your statement before judging the fund
Download the transaction history and check every contribution, withdrawal and payout. Verify that the app includes old holdings and transfers correctly. Record the current value and its date. For comparing funds, use matching periods and a relevant market comparison. For checking your own progress, use your own payments and dates.
A gap between the two returns is not, by itself, proof that the fund is poor or that you should sell. It is a reason to understand the calculation first. The useful question is whether your investment, costs and level of risk still fit the goal you chose.
Educational content, not personal investment or tax advice. All prices and returns in the example are invented. Past performance does not guarantee future returns. The linked calculator is an explanation of a method, not a fund recommendation. Sources checked on 2 October 2026.