
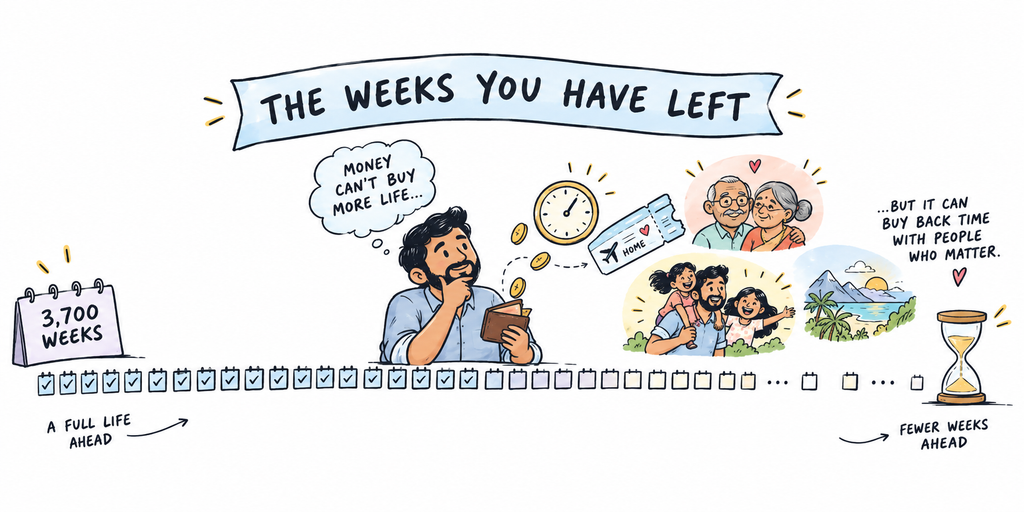
Every other page on this site is about money. This one is about what the money is for. It is still a page of sums. They are just sums about time.
A life, counted in weeks
The government publishes a life table. It says how long people in India live, and it is the honest place to start. A life here runs about 70 years. Put that in weeks and you get roughly 3,700. That is the whole thing. Childhood, school, every job, every holiday, everyone you will ever meet. Three thousand seven hundred weeks. You may have seen the figure 4,000 used for this. That comes from richer countries where people live a few years longer. Ours is a bit smaller.
But 70 is not your number
Here is where almost everyone goes wrong, and it matters for your money. That 70 is the average for a baby born today. It is pulled down by the babies and children who die young. If you are reading this, you got past all of that. So your own number is higher. The longer you have already lived, the higher it goes.
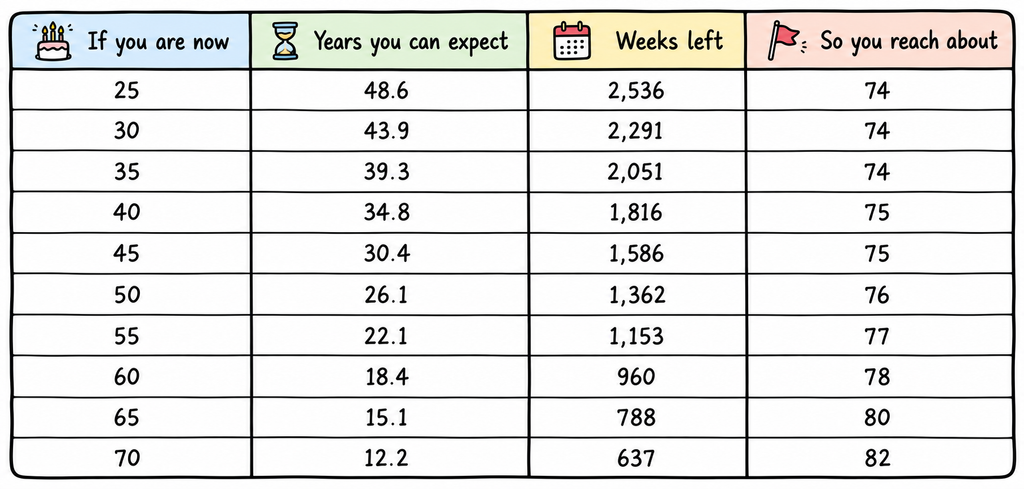
Read the last column slowly. A man of 60 in India is not near the end. He can expect to reach 78. This is the single most expensive mistake in retirement planning here. People plan to 70 because that is the number they have heard. Then they live to 80, and the last ten years have nothing behind them. Our retirement calculator runs on this properly.
Women should add a few years to all of it. At 60 a woman can expect to reach 80, not 77.
Now the part that is already spent
Those weeks are not free time. Most of each one is already promised to something. A week holds 168 hours. Sleep takes 56 of them. That leaves 112 hours awake. Now take a normal job. Forty five hours of work. Say an hour and a half of travel each way, which is kind for most cities. That is 53 hours. So work takes 47% of the hours you are awake. Nearly half. You are left with about 60 hours a week for everything else, and that includes eating, chores, bills and being ill.
This is not a complaint about work. Work is what pays for all of it. It is just worth seeing the size of the slice, because that slice is the thing money can move.
The sum nobody does
Here is the sum that changes how this whole subject looks. You do not have a certain number of weeks with your parents. You have a number of days, and it is much smaller than you think. Take a parent who is 70. The table says they have about 12 years left. If you live in another city and get home twice a year for five days, that is ten days a year.
Twelve years, ten days a year. About 120 days. Four months. That is what is left, in total, for the rest of their life.
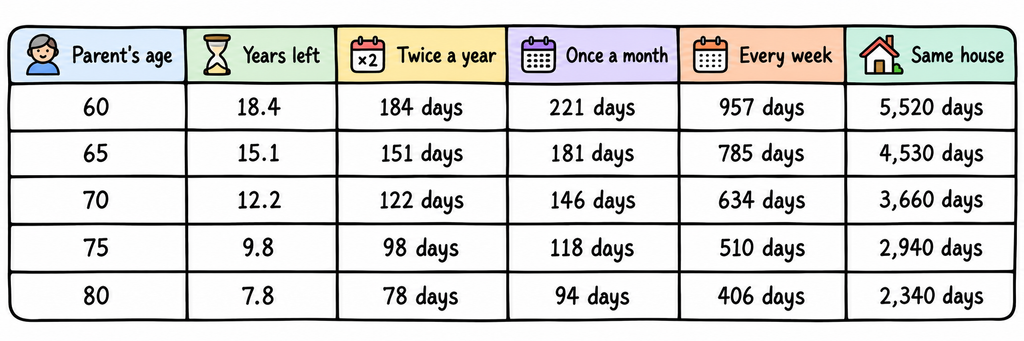
Look across any row. The gap between the first column and the last is enormous. Same parent, same years. Only the frequency changed. That gap is the thing money actually buys.
Children run on a different clock
With a child it works the other way round, and it catches people out. You see them every day, so it feels endless. It is not. It mostly ends at 18, when they leave for college or work.
- A child of 5 has about 4,700 days at home with you.
- A child of 8 has about 3,650.
- A child of 14 has about 1,460.
After that they become a person you visit. Which is right and normal. But the daily part is over, and the years you were busiest at work were probably the same years.
What money can and cannot do here
Be clear about this, because it cuts both ways.
Money cannot buy more weeks. Nobody has ever bought a year. Good food and good doctors help a little, and that is all.
Money can change who you spend them with. That it does very well.
- A flight home is a few thousand rupees. Four trips a year instead of two doubles a column in that table.
- Living closer to work usually costs more rent. It also hands back an hour a day, which is 15 days a year.
- Savings let you take the job that pays less and ends at six.
- Enough savings lets you stop early, while your parents are still here and your knees still work.
Every one of those is a purchase. You are spending money to buy days. That is a completely reasonable thing to do with it.
Which way the mistake usually goes
There are two ways to get this wrong, and both are common. One is spending everything now, because you might not be here later. The table above says you probably will be here. Then you are old and poor, which buys you nothing at all.
The other is saving hard for thirty years and never once spending any of it on time. Missing the trips home. Taking the job that pays more and ends at nine. Then retiring at 60 with plenty of money and finding that some of the people you were saving for are gone.
The first mistake is loud and everyone warns you about it. The second is quiet, and nobody does.
What to actually do
- Find your own row in the first table. Not 70. Your number. Then plan your retirement money to a few years past it, not to it.
- Do the parent sum once. Their age, how often you see them. It takes a minute. Most people never do it and would change something if they did.
- Price one extra trip a year. Compare it to what you spend on things you have forgotten you pay for. The payments you forgot about is usually where it is hiding.
- Know your savings rate. It decides how many working years you have to do. The savings rate calculator turns it into a number of years.
- Treat time like money when you choose a job. A raise that costs you ten hours a week is a pay cut in the only currency you cannot earn more of.
Why this site exists
Everything here, every calculator and every page about tax, is in service of one small idea. Money is not the point. It is a tool for buying back your own hours. That is all it has ever been. What this site is for says the same thing in a different way. People who are careful with money and never buy anything with it have simply swapped one master for another. So keep saving. Keep the costs low. Do the boring things that work.
And now and then, spend some of it on a flight home. You have about 3,700 weeks. You have already used a good number of them reading this far.
This article is for learning. It is not personal financial advice. The life figures come from the government’s Sample Registration System abridged life tables for 2019 to 2023, all India, men and women together. They are averages across a whole country and say nothing about any one person, so treat them as a way to plan and not as a forecast. Health, where you live and family history all move the number. The working hours used are an example. For advice about your own money, speak to a SEBI-registered investment adviser.