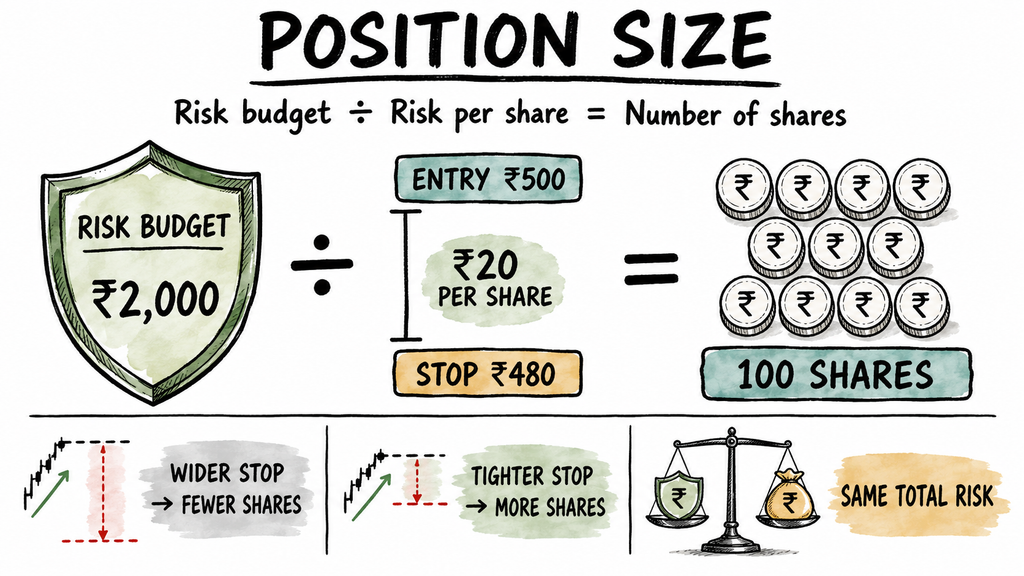
Ask most people how they decide how many shares to buy, and the honest answer is some version of “as many as I can afford, adjusted for how good I feel about it.” That is the most expensive habit in trading, and it is entirely fixable, because position size is one of the very few things in this business that has a correct answer.
Not a correct opinion. A correct number, which falls out of the sums once you have decided two things in advance.
1. The Question You Are Actually Answering
There are two ways to arrive at a quantity, and they produce wildly different results.
Say you have ₹2,00,000 in your trading account and you are looking at a stock trading at ₹500. Your analysis says the trade is invalid below ₹480.
Affordability sizing asks how many shares the account can buy. That is 400 shares, using the whole account. If the stock reaches ₹480 and you exit as planned, you lose ₹20 on each of 400 shares, which is ₹8,000. That is 4% of everything you have, gone on one ordinary trade that did not even go badly wrong. It did exactly what you expected it might do.
Risk sizing asks the opposite question first: how much am I prepared to lose here? Suppose that is 1% of the account, so ₹2,000. The stop is ₹20 away. Two thousand divided by twenty is 100 shares, a position worth ₹50,000.
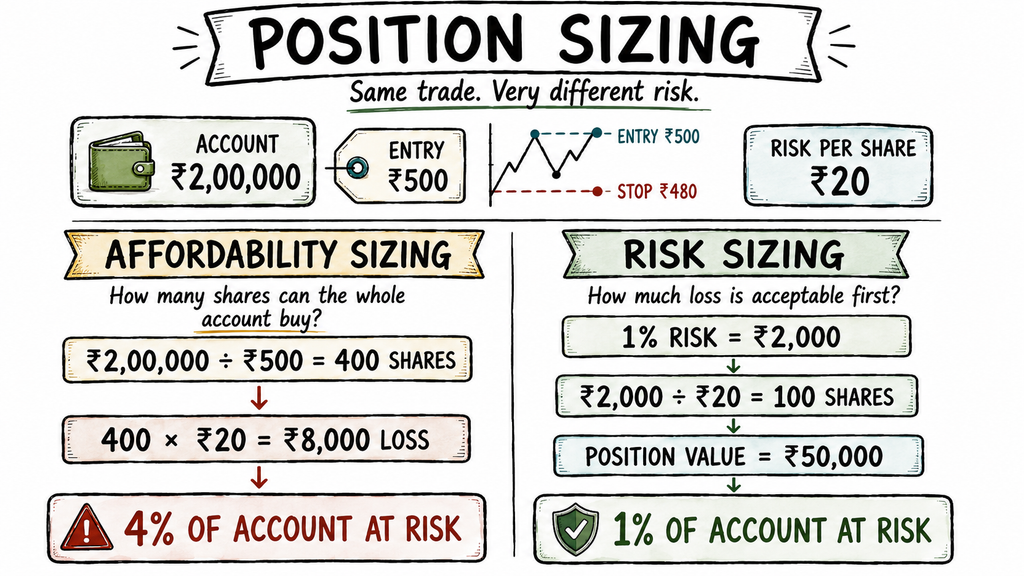
Same account, same stock, same view, same stop. Four hundred shares or one hundred. The only difference is which question got asked first.
Notice what risk sizing quietly does. It makes the size a consequence rather than a choice. You are no longer deciding how much to buy, which is a decision you are poorly equipped to make while looking at a live chart. You are deciding how much to lose, which is a decision you can make calmly on a Sunday.
2. The Formula
The whole thing fits on one line.
Position size = (account size × risk per trade) ÷ (entry price minus stop price)
Three inputs. The account size you know. The risk percentage you decide once and rarely change. The stop distance comes from the chart, and it is different on every trade.
That third input is where the interesting behaviour lives. Keep the account at ₹2,00,000, the risk at 1% (so ₹2,000 every time), and the entry at ₹500, then vary only where the stop sits:
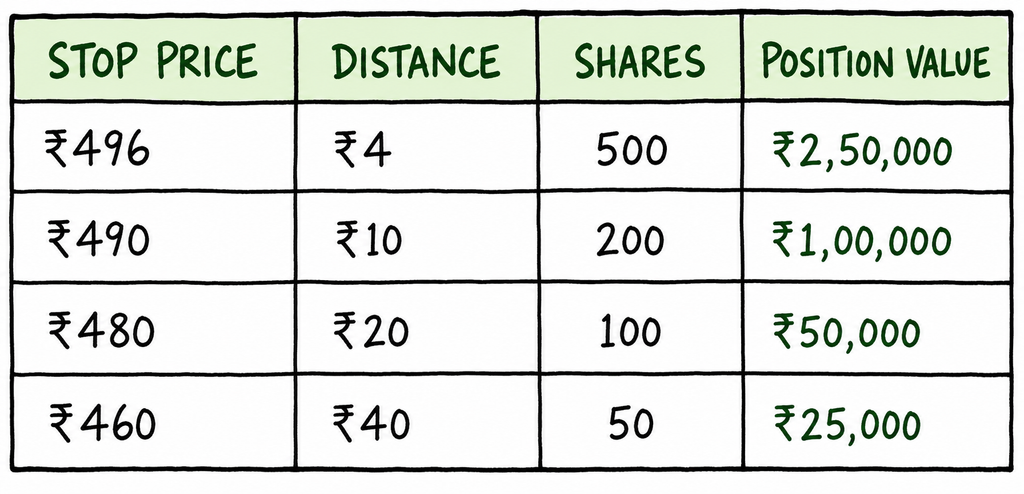
Every row risks exactly ₹2,000. The position values differ by a factor of ten.
This is the part that surprises people. A tight stop does not make a trade safer. It makes the position bigger. The rupees at risk stay the same, but you now own a great deal more of something, which means ordinary noise is far more likely to reach your stop before the idea has had a chance to work.
Look at the top row as well. A ₹4 stop produces a position worth ₹2,50,000 on a ₹2,00,000 account. The formula does not know that is impossible without borrowing. This is exactly why the formula needs limits sitting on top of it, which is section 5.
Always round down
The sums will rarely give you a whole number. A ₹2,000 budget against a ₹15 stop produces 133.33 shares.
Buy 133. Never round up to 134, and certainly never to a comfortable looking 150, because the moment you do that the number you calculated stops being a limit and becomes a suggestion. Rounding down costs you a rupee or two of potential profit. Rounding up quietly reintroduces exactly the guesswork the formula exists to remove.
3. Choosing the Percentage
The convention is 1% to 2% of the account per trade. That sounds absurdly small to anyone who has not sat through a losing streak. The reason is that losing streaks are not unusual events. They are a normal feature of any method, including good ones.
Here is what ten consecutive losses do to an account, at different risk settings:
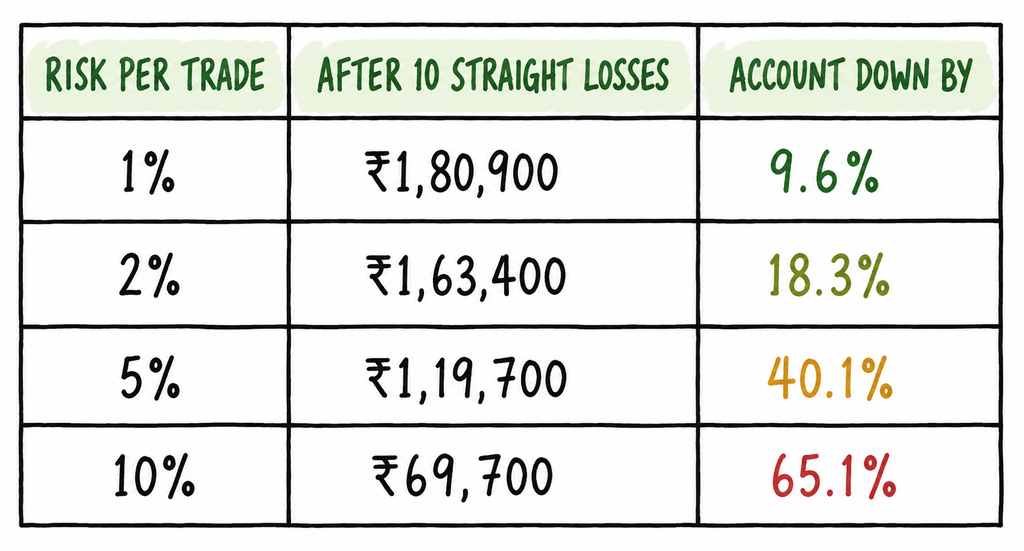
At 1% you have had a bad fortnight. At 10% you have had a catastrophe, from exactly the same run of trades.
And the damage is worse than it looks, because losses and gains are not symmetrical. Getting back to where you started takes more than the percentage you lost:
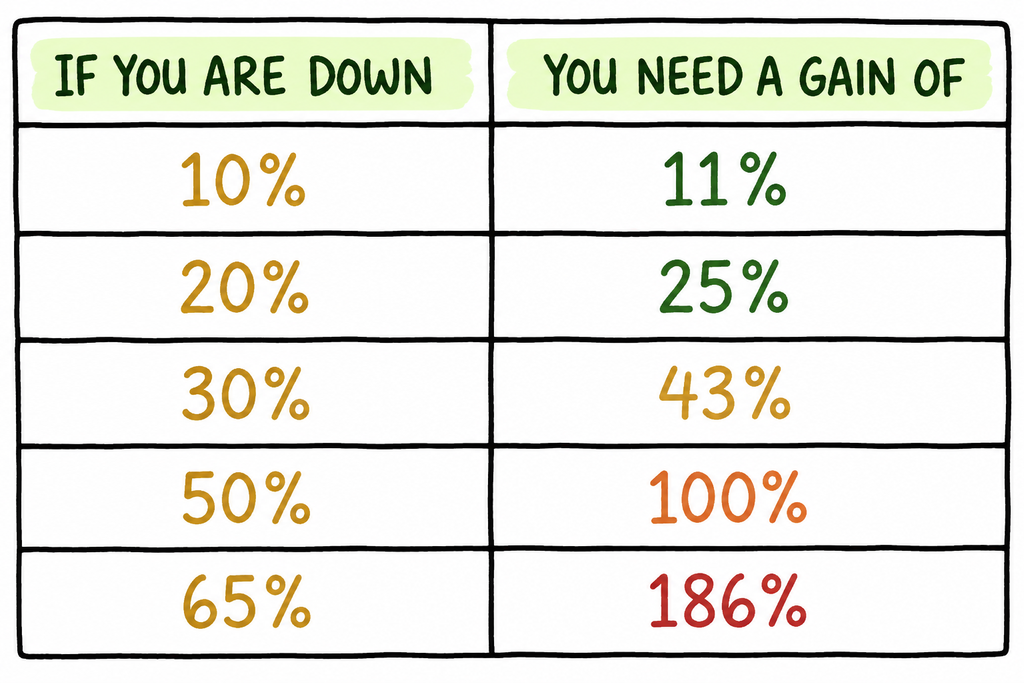
A 10% hole is a few good weeks. A 50% hole requires you to double your money simply to be back where you began, and most people never get there, because the account is now too small to trade the way that produced the gains in the first place.
Small risk per trade is not timidity. It is what keeps you in a position to keep playing.
One practical note. If you are new, use a smaller number than you think you need. The first months of trading are tuition, and the sensible aim is to pay as little of it as possible while you find out whether any of this suits you.
4. The Stop Comes First, Always
Everything above depends on the stop being placed honestly, and there is a very natural way to cheat.
You want a big position. The formula will not give you one, because your stop is far away. So you move the stop closer, the size obligingly increases, and you tell yourself you are being disciplined because the rupee risk is unchanged. You are not. You have simply raised the chance of being stopped out by ordinary movement that had nothing to do with your idea being wrong.
The stop belongs where the trade is genuinely invalid, which is a question about the chart and not about your ambitions. In practice that usually means beyond the zone rather than inside it, for the reasons covered in support and resistance in plain language. If the honest stop is far away, the honest position is small. That is the trade telling you something useful.
Volatility matters here too. A stock that routinely swings 3% in a day needs more room than one that drifts 0.8%, or you will be stopped out most days by nothing at all. Same rupee risk, wider stop, smaller position. The formula handles it automatically once you let the chart set the stop.
When one lot is already too big
Everything so far assumes you can buy any quantity you like. In the cash market you very nearly can. In futures and options you cannot, because contracts trade in fixed lot sizes, and a single lot of an index or a large stock can carry several lakh rupees of exposure.
Run the sums anyway. If your risk budget is ₹2,000 and your stop implies a loss of ₹8,000 on one lot, the answer is not to move the stop closer until the number fits. The answer is that this trade is not available to you at this account size. One lot is your minimum, and your minimum is four times too large.
That is an unglamorous conclusion, and it is the correct one. It is also, quietly, part of why SEBI’s data shows the smallest accounts absorbing such a disproportionate share of derivatives losses. A trader whose minimum possible position is far bigger than their risk budget is not really position sizing at all. They are discovering the mismatch one trade at a time.
The same squeeze appears in the cash market on a small account. With ₹25,000, one percent is ₹250. A ₹20 stop leaves you twelve shares, and after brokerage and the various statutory charges there may be very little left of even a good trade. Better to know that before you begin than to learn it slowly.
5. The Limits That Sit On Top
The formula sizes one trade in isolation. Four rules stop that from becoming a problem across a portfolio and across a day.
- A cap on any single position. Pick a maximum share of the account, perhaps 20% or 25%, and apply it no matter what the sums say. This is what catches the ₹2,50,000 position from the first table. A very tight stop should reduce the risk, not quietly hand you leverage.
- A cap on total open risk. Add up what you would lose if every open position hit its stop at once. On a genuinely bad day, they can. Four positions at 1% each is 4% of the account riding on one morning, which may be more than you intended.
- Treat correlated positions as one. Three bank stocks are not three trades. They will fall together on the same news, so size them as though they were a single position, because that is how they will behave when it matters.
- A daily loss limit above everything. Correct sizing on each individual trade still permits six trades in a row while you are trying to win back the morning. The daily limit is what ends that, and it belongs in the plan you wrote before the session, as covered in building a trading plan before the opening bell.
One warning that deserves its own line. Intraday margin makes every limit above trivially easy to breach without noticing, because the broker will happily let you take a position several times the size of your account. Margin does not change how much you stand to lose. It only changes how quickly you find out.
Put the three articles in this series together and the shape is simple enough. The plan decides what you will trade and when you will stop. The levels decide where the trade is proven wrong. The sizing decides how much that costs you.
Only the last of those is just a sum, which makes it the one part you can get right every single time, regardless of how the market behaves or how you feel that morning.
Work it out before you enter. Write the number down. Then place that order and not a larger one.
This is educational content, not personal financial advice or a recommendation to trade. Trading in equities and derivatives carries a real risk of substantial loss, and SEBI’s own studies show most individual traders lose money. The figures above are simplified worked examples, not forecasts or suggestions about any particular trade or level of risk. For decisions about your own money, speak to a SEBI-registered investment adviser. Past returns don’t mean future returns will be the same. Everything can fall. Everything can go up. Trade accordingly, or don’t.